
SPSS-based nonparametric tests
Currently, there are three main methods for nonparametric tests based on SPSS: the rank sum test for two related samples based on SPSS software, the rank sum test for two unpaired (independent) samples based on SPSS software, and the signed rank sum test for multiple samples based on SPSS software.
Principle
The basic principle of non-parametric test is non-parametric test is in the overall distribution does not obey the normal distribution and the distribution is not clear, used to test the data from the same overall hypothesis of a class of tests. In the test does not need to use the overall parameters (such as the mean, standard deviation, etc.) of the information, mainly the use of sample data between the size of the comparison and the size of the order of the two or more samples belong to the overall test is the same.
1. Non-parametric test of two sample data
According to the different methods of experimental design, the non-parametric test of two samples can be divided into two related samples of non-parametric test and two groups of unpaired (independent) samples of non-parametric test. Two related samples are often two or more indicators measured from a single subject, and these indicators are viewed as sampling separately, when the two groups of samples are not independent but correlated due to the fact that the sampling of one indicator has an impact on the sampling of the other. Two independent samples means that sampling from one population has no effect on sampling from the other.
(1) Non-parametric test of two correlated samples
Non-parametric test of two related samples to have a sign test (sign test) and Wilcoxon signed rank sum test.
① Sign test Sign test is based on the sample of the size of the difference between the positive and negative sign of the data to test, without regard to the size of the difference, the difference between each pair of data for the positive value of the "+" expressed in "negative values with the" - "indicated, and then through the comparison of the sign of the number of "+" and "-" for statistical inference. The basic idea and principle of the test is to assume that the two samples belong to the overall subject to the same distribution, the probability of occurrence of positive or negative sign should be equal, if not exactly equal, at least should not be too large a difference, when the difference exceeds a certain threshold, it is considered that the two samples belong to the overall significant differences, they do not obey the same distribution. The formula is as follows:

The value of γ obtained with the sample will be compared with the critical value γ0.05 (N), γ0.01 (N) to make a statistical analysis. The sign test can also be solved using x. The formula is as follows:

Compare the calculated x2 value with the x2 critical value ( x20.05, x20.01) and make an inference.
Wilcoxon signed rank sum test The Wilcoxon signed rank sum test improves on the signed test by considering the magnitude of the difference. The difference of each pair of data is expressed as "+" for positive values and "-" for negative values, and then the absolute value of the difference is sorted in ascending order and the corresponding rank is calculated (if there is a homogeneous rank, a homogeneous correction is required). The positive and negative ranks are summed up separately, and the rank sum is expressed as T, the sum of positive ranks, and T_, the sum of negative ranks, and the absolute value of the rank sum that is smaller is taken as the test statistic Tn = min(T, T_). According to the sample size of the number of pairs of n check the symbolic rank sum test table to get the significance level of 5% and 1% of the critical T value, with T0 value and the critical value of the critical value of comparison, when less than the critical value of a certain level, it is indicated that the difference is significant at this level of significance. 5% and 1% of the critical T value of the significant level of significance can be calculated by the following formula:

At n infinity, the sampling distribution of the T-value of the test statistic tends to be normally distributed N (µ, σ2 ). Therefore, as long as n is appropriately large (typically n ≥ 19), it can be approximated by the Z-test, which is calculated using the following formula:

(2) Rank sum test for unpaired (independent) data of two groups
The rank sum test for two unpaired data is a comparison between two independent samples drawn from two independent totals, which is also known as the Mann-Whitney (Mann-Whitney) rank sum test.
Combine the two groups of data, according to the size of the value from small to large, each value corresponding to the order of the number of the value of the rank, the smallest value of the rank of 1, the largest value of the rank of the two groups of the sum of the sample capacity, i.e., "n1 + n2", the same value of the calculation of the average rank; will be the two groups of the rank of the sum of the two groups of the rank of the most small group of the rank of the sample capacity and as a T-value; T-value with the data according to the n, and n2 check into the group The T-value was compared with the critical value obtained from the rank sum test table according to n, and n2 for significance analysis.
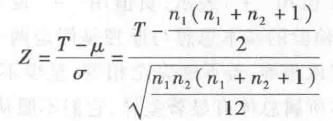
The unpaired data rank sum test table only lists the cases where n1 and n2 are smaller than 10, when n1 and n2 are larger than 10, the rank sum T follows normal distribution, so it can be approximated by the Z-test, and its calculation formula is as follows:
2. Rank-sum test for multiple samples
The rank sum test for multiple samples is also known as the Kruskal-Wallis test, which uses the rank sum of multiple samples to infer whether the overall distribution they represent is the same. This test is also known as the H-test because the test statistic is denoted by H. The formula is as follows. The formula is as follows:

Where: N is the total number of observations; n; is the sample capacity of group i; T, is the rank sum of group i. The calculation of the rank of each observation is the same as that of the rank sum test for two groups of unpaired data. When the number of groups k ≥ 3 in the data and the sample capacity of each group is greater than or equal to 5, the sampling distribution of the statistic H approximates the distribution of x2 at df = k-1, and thus the value of x2 at df = k-1 can be used as a critical value to determine whether the difference in the rank sums of the groups is significant. For k = 3 and each group contains less than 5, the correct Kruskal-Wallis probability table needs to be used for comparison. If there are more average rank sums in the sample, the H-value should be corrected with the following correction formula:
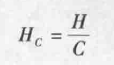
Where: C is the correction coefficient, calculated as follows:

Where: t is the number of individuals with the same value.
For more product details, please visit Aladdin Scientific website.