
Simple Excel-based correlation and regression analysis
Currently, there are three main methods for simple correlation and regression analysis based on Excel: simple correlation analysis based on the Excel spreadsheet paste function CORREL, simple correlation analysis based on the Excel spreadsheet "correlation coefficient" analysis tool, and simple regression analysis based on the Excel spreadsheet.
Principle
The basic principle of Excel-based simple correlation and regression analysis is that, in general, relationships between biological data variables are non-deterministic statistical correlations, such as newborn weight and weaning weight, height and weight, and backfat thickness and lean body mass. When the change in another dependent variable can be described using only one independent variable and a linear relationship, it is called simple linear correlation or regression (simple linear correlation or regression).
1. Simple correlation analysis
Correlation analysis (correlation analysis) is mainly used to study the relationship between related variables in parallel. Correlation analysis of the linear relationship between two variables is called simple correlation analysis (also called linear correlation analysis). If there is a simple correlation between two variables, the scatterplot is mostly around a straight line, showing a positive correlation trend as the x value of the variable increases and the y value of the variable increases, or a negative correlation trend as the x value of the variable increases and the y value of the variable decreases. The coefficient of correlation is a measure of the size of the linear relationship between two variables.
The overall correlation coefficient is calculated by the formula:
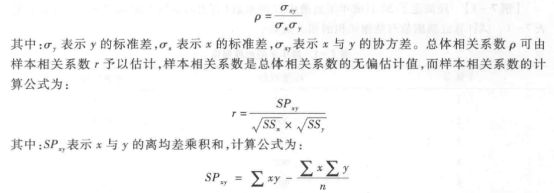
The significance of the overall correlation coefficient is estimated by testing the hypothesis of the sample correlation coefficient, r, in order to determine whether there is a significant correlation between the overall variables. The main task of simple correlation analysis is to investigate the extent and nature of linear correlation between two variables.
2. Simple regression analysis
Regression was proposed by Francis Galton, a British statistician, when he studied the height of offspring and the height of parents. Regression analysis is mainly used to study the relationship between variables that are causally related, where the variable that represents the cause is called the independent variable (x) and the variable that represents the effect is called the dependent variable (y). A linear regression analysis that examines one independent variable and one dependent variable is called simple regression analysis.
Regression analysis shows a relatively strict subordination between two variables, which is the study of a non-deterministic relationship in terms of a strict functional relationship. If the pattern of change of the two variables is roughly linear, the straight line should be found and a regression equation should be used to describe the curve, so as to estimate and predict the change of the dependent variable y according to the change of the independent variable x. The linear regression equation of y on x is generally expressed as follows:
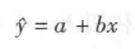
ŷ is the estimated value of y, there is a certain difference between ŷ and y; x is the independent variable, each xi corresponds to a ŷi ); a is the intercept of the straight line on the y-axis, i.e., the value of ŷ when x = 0; b is the regression coefficient, the slope of the straight line, which refers to the average amount of change in the dependent variable y when the independent variable x changes by one unit.
The main task of regression analysis is to reveal the form of the link between the relevant variables in a causal relationship, establish the regression equation between them, and use the established regression equation to predict and control the dependent variable (result) by the independent variable (cause).
It is necessary to point out that the simple correlation and regression have a close connection, but there are also essential differences, mainly in three aspects: First, simple linear correlation is a linear relationship between the variables is the degree of closeness of expression, simple linear regression is the variables in the linear correlation of the variables on the basis of the establishment of a linear model, that is to say, the correlation is not necessarily regression, and vice versa, the regression is necessarily correlation. Second, regression analysis can estimate and predict the variables, while correlation analysis does not have this function. Thirdly, the variables in linear correlation analysis are equal in status, all of them are random variables without primary or secondary causation, whereas the variables in linear regression analysis are independent and dependent, and the independent variable is generally a deterministic variable such as age, while the dependent variable is a random variable such as weight at a certain age.
For more product details, please visit Aladdin Scientific website.