
SPSS-based multiple linear regression with curvilinear regression analysis
Currently, there are three main methods of multiple linear regression and curve regression analysis based on SPSS: multiple linear regression analysis based on SPSS software, regression analysis based on SPSS curve estimation program, and curve regression analysis based on SPSS nonlinear regression (nonlinear) program.
Principle
The fundamentals of SPSS-based multiple linear regression and curvilinear regression analysis are:
1. Multiple linear regression analysis
Multiple linear regression (multiple linear regression) analysis is a method to analyze the quantitative relationship between multiple independent variables and a dependent variable, and regression diagnosis can be made. The principle of multiple linear regression analysis is basically the same as that of univariate linear regression analysis, and the purpose of the analysis is to establish multiple linear regression equations for predicting and controlling the dependent variable by multiple independent variables, i.e., to determine the individual and combined effects of multiple independent variables on the dependent variable, and to carry out a test of significance for the above individual and combined effects, and to select the independent variable that has a significant effect on the dependent variable to establish the optimal multiple linear regression equations.
Let there be a linear relationship between the dependent variable y and the independent variables x1, x2,, xm, and its mathematical model is:

The sample data used for the multiple linear regression analysis is obtained from the actual measurement of n individuals, i.e., there are n groups of observations, and each group of data contains the measured values of 1 dependent variable and m independent variables, and each group of data constitutes a sample point, and its data structure is shown in Table 8-1.

The data structure is shown in Table 8-1. An m-dimensional linear regression equation calculated from the n groups of actual observations can be expressed by the following equation:

Where: ŷ is the estimate of the multiple linear regression, b0, b1, b2, ----, bm are the least squares partial regression coefficients estimates of β0, β1, β2,, βm, which should minimize the off-regression sum of squares, Q. i.e:
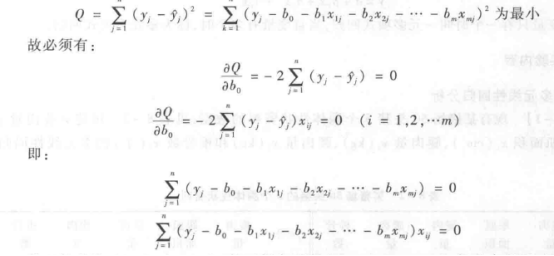
Organize to get the system of formal equations (normal equations) about b0, b1, b2,, bm, solving this system of equations, we can get b0, b1, b2,, bm, and then we get the m-dimensional linear regression equation is:

Commonly used statistical software in multiple linear regression analysis of the formal system of equations in solving bo, b1, b2, ---, bm, are used in the matrix method, so do not have to consider the problem of calculation. Whether the multiple linear regression equation is meaningful or not, the F-test is used, and when the test is significant the existence of a multiple linear relationship, then the significance of the partial regression coefficients is tested, which can be done with the t-test or with the F-test, eliminating the insignificant self\rac3 variables, and ultimately establishing the optimal multiple linear regression equation.
2. Curvilinear regression analysis
Curvilinear regression analysis is to establish curvilinear regression equations to reveal the intrinsic connection and change rule between variables when the relationship between the actual observed values of two related variables is curvilinear. Curve regression analysis can be divided into two cases, namely, known curve type and unknown curve type regression analysis.
(1) Known curve type
The so-called known curve type refers to the curve type that can be determined according to the theory, experience or analysis of sample data, that is, according to the trend of expertise and scatter distribution to determine the curve type, the biggest characteristic of this type of curve is that the curve function is known.
Common known curve types are hyperbolic function model  ; exponential function model
  ; logarithmic function model
  ; power function model (y = axb ); Logistic (S-type) growth curve model
 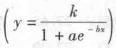 and so on.
(2) Unknown curve types (polynomial regression)
When you can not find a known curve function to fit the distribution trend of the measured points, this type of curve is called the unknown curve type, at this time the most commonly used method is to use polynomial regression to fit the distribution of the measured points, you can also use polynomial regression, by gradually increasing the polynomial of the higher terms to fit, until satisfied. The principle is that any function can be approximated by a polynomial, ie:


When there is only one independent variable it is called monomial polynomial regression and when there are more than one independent variables it is called multinomial polynomial regression.
For more product details, please visit Aladdin Scientific website.