
SPSS-based data collation and analysis
At present, there are four main methods for organizing and analyzing data based on SPSS: descriptive statistics based on SPSS software, grouping and frequency distribution plotting of discrete data based on SPSS software, grouping and frequency distribution plotting of continuous data based on SPSS software, and statistical graphing based on SPSS software.
Principle
The basic principle of SPSS-based data organization and analysis is that when the data is large and the distribution pattern cannot be visualized, it is usually necessary to use the grouping method to organize and describe the statistics of the data. Discrete information can be directly using the category of information or natural values for grouping, while for more categories of counting information, a number of adjacent natural values as a group.
Continuous information is generally grouped using the group spacing grouping method. Grouping, first find out the maximum value and minimum value of the information, the full distance; according to the information in the data (that is, the sample size) to determine the approximate number of groups to be divided; with the full distance divided by the number of groups to get the group distance (in order to facilitate the grouping, as far as possible, the use of integers as the group distance); and then to determine the first group of the group's lower limit (less than or equal to the smallest value in the information), and then in turn plus the group distance to get the second group of group lower limit, the third group of group lower limit, the last group of group lower limit, the last group of group lower limit, the second group of group lower limit. group lower limit, the last group of group upper limit should be greater than the maximum value in the information. After the group is good, the information will be assigned to the value of each group in turn, and finally counted the frequency of each group, listed in the frequency distribution table. The frequency distribution table can also calculate the frequency of each group and the cumulative frequency from the first group to the last group.
The use of Excel and SPSS software can be more convenient to group the information, listed in the frequency distribution table. According to the frequency distribution table can be centralized and discrete degree of information for intuitive analysis. Of course, a more intuitive form is to use the data to make statistical graphics. Generally speaking, the use of bar charts (bar charts) to indicate the frequency (frequency) distribution of various categories of discrete data, fewer categories of categorical data can be used to indicate the relative ratio of various categories of pie charts; and continuous data are mostly used to show the distribution of histograms, Excel and SPSS have a very good function of drawing statistical graphs.
The descriptive statistics of the data mainly use the characteristic values of arithmetic mean, geometric mean, harmonic mean, median and plural to describe the concentration of the data, and use the characteristic values of allometric distance, variance, standard deviation and coefficient of variation to describe the dispersion of the data; and use the characteristic values of skewness and craggyness to reflect the deviation of the data from the normal distribution. If the skewness value is greater than 0, the distribution is skewed to the left; if the skewness value is less than 0, the distribution is skewed to the right. If the skewness value is greater than 0, the distribution of the data is sharper than the normal distribution; if the skewness value is less than 0, the distribution is flatter than the normal distribution; Excel and SPSS software can calculate the above descriptive statistics at the same time, but it is necessary for us to interpret the nature and distribution of the data according to the statistical results.
Operation method
SPSS analysis of qPCR data
Principle
Since there is a linear relationship between the Ct value of a template and the starting copy number of that template during the exponential period of PCR amplification, that Ct value becomes the basis for experimental quantification.
Materials and Instruments
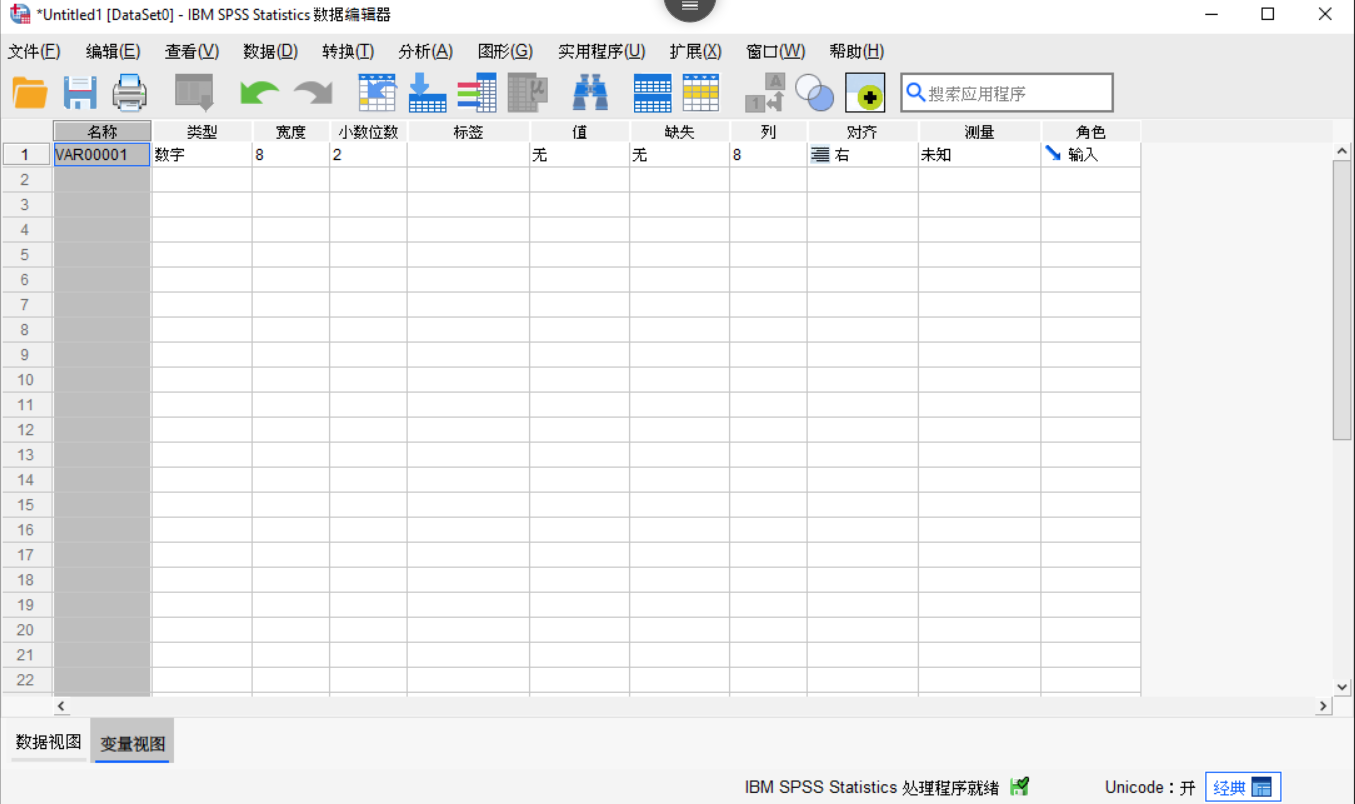
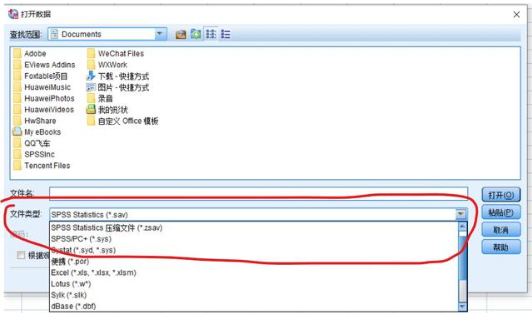
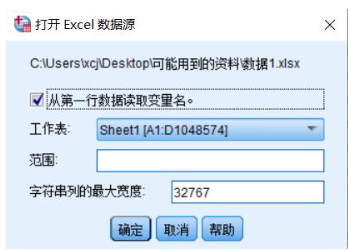
spss software/web version, qPCR data files Move 1, recognize the SPSS software interface The SPSS interface is similar to the ordinary EXCEL interface, where you can set variable types horizontally and specific variable data vertically. Click on the following label can be converted to the variable view, set the type of variable. We directly enter data in this interface on the line. 2、Data Import Method 1: standard import Click: File - Open - Data, select the data file you want to import in the dialog box. Method 2: Drag and Drop Import Directly drag the data Excel file into the SPSS operating page, data dragged into the following interface will appear, click OK. 3, descriptive statistical analysis Calculate and analyze the mean, variance, standard deviation, etc. of the data. Click: File - Analysis - Descriptive Statistics - Frequency - Check the required statistics. 4、q-PCR data statistics: compare Ct method ( 2-△△Ct ) First of all, ensure that the data are accurate and comply with MIQE standard 1. The following is an example of how to analyze the data with 3 replicates in each group. Group S ample C t target C t target C t mean of T C t reference C t mean of R C ontrol Sample 1 22.89 22.90 15.29 15.63 22.82 15.91 23.00 15.69 Sample 2 22.60 22.64 15.83 15.60 22.46 15.71 22.85 15.27 Sample 3 22.49 22.53 14.81 14.98 22.49 14.79 22.60 15.34 Experimental Sample 1 25.32 25.31 14.98 15.18 25.40 15.33 25.20 15.22 Sample 2 25.70 25.60 15.46 15.46 25.50 15.45 25.61 15.22 Sample 3 25.49 25.49 15.25 15.05 15.05 25.68 14.60 25.64 15.29 The data are two groups of 3 PCR data each. The amount of change in the target gene (the ratio of the amount of the target gene to its corresponding internal reference gene, or 2-ΔCt ) was measured first, and the same was done for the control group. Then compare the average value of the experimental group with the 2-ΔΔCt of the control group to obtain the 2-ΔΔCt, which is the fold change.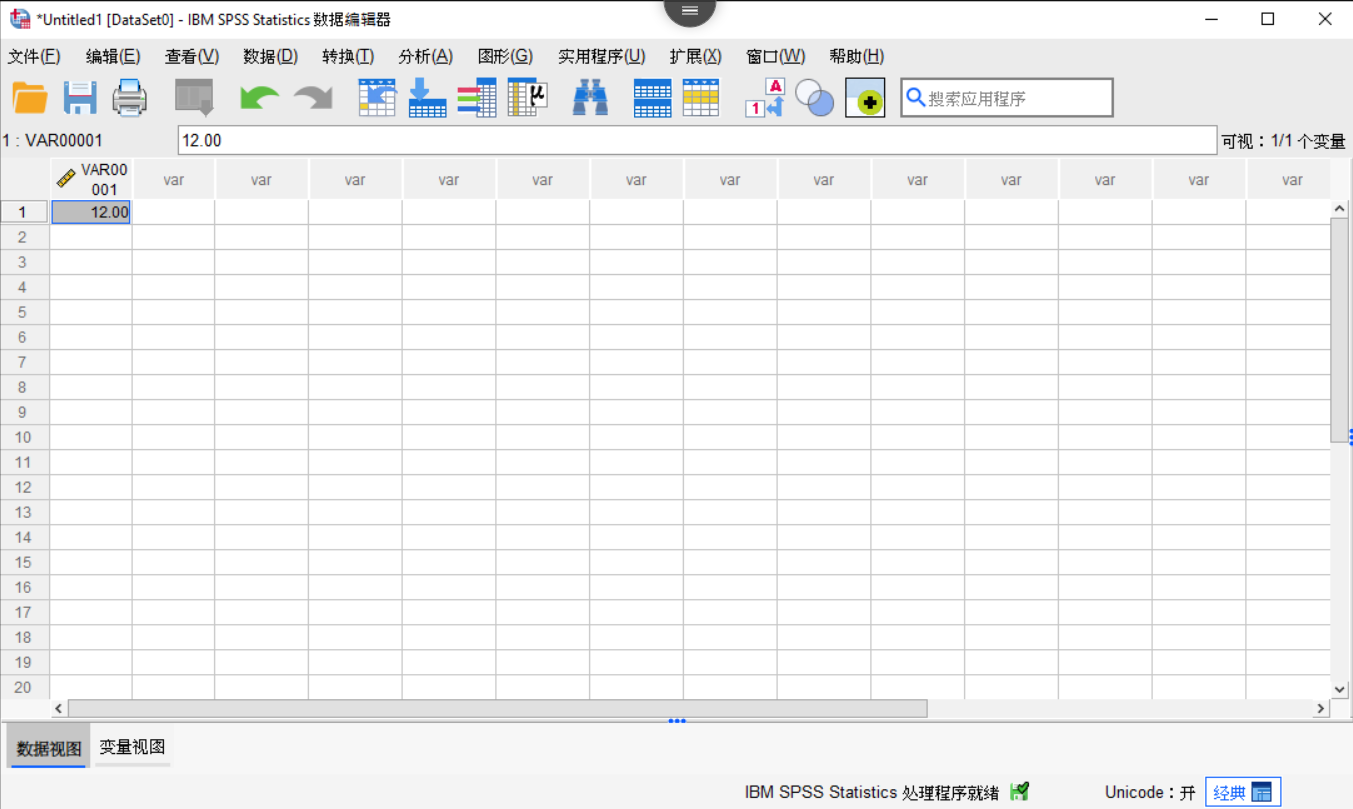

5、Choose the correct statistical method to carry out difference statistics
(1) The t-test is used to calculate the p-value based on the difference between the means of two groups of data. t-test's main assumption is that the two groups of data are independent and conform to the normal distribution. t-test is one of the most famous non-parametric statistical tests compared to non-parametric tests;
(2) Wilcoxon rank sum test (sometimes called the Mann-Whitney U test; not to be confused with the Wilcoxon signed-rank test, which is used to compare two paired groups). One advantage over parametric statistical tests (such as the t-test) is that they do not depend on whether the data are normally distributed;
(3) The Kolmogorov-Smirnov test for normal distribution can be used to decide whether to apply a t-test or a non-parametric test.
6. p-value analysis
Usually we encourage the specific absolute value of p to be reflected in the table, because p_ will hide the absolute value of p. And when presenting the true absolute value, the p-value of 0.032 is slightly more "meaningful" than the p-value of 0.055.
Caveat
1. Incorrectly set variable type. For example, a qualitative variable is set as a quantitative variable. The solution is to determine the type of the variable according to its nature, and to distinguish clearly between qualitative and quantitative variables.
2. Wrong choice of statistical methods. Not choosing a reasonable statistical test method according to the characteristics of data type and data distribution, or not understanding the principles and assumptions behind various parametric tests, which will make the test results unreasonable, thus generating erroneous statistical inferences. The solution is to systematically learn the theoretical knowledge of each statistical test method and learn to choose the correct judgment.
3. Misunderstanding of p-value. It is a mistake to consider the size of the p-value itself as the size of the difference or correlation between groups, for example, to think that the data with p<0.01 are more different from each other than the data with p<0.05! Comparison of these two p-values can only conclude that the difference between the groups is statistically different, or that the former is less likely to be wrong, while comparing the p-value with the higher and lower p-values will lead to a misunderstanding of the p-value, which in turn will lead to a misjudgement. The solution is to correctly understand the p-value represents the level of confidence or significance of the test results.
4. After repeating the PCR experiment several times, the standard curve overlap is small, and the repeatability of the experiment is poor?(1) The baseline setting is too low, which affects the precision and accuracy. The solution is to set the baseline manually and set the baseline end value (End) before the signal rises.(2) Sampling error, for example, the PCR reaction solution is not completely mixed when preparing the reaction solution, resulting in different composition in each well. The solution is to mix the reaction solution well before dispensing (shaking, blowing). At the same time, before loading, centrifuge the PCR tube or PCR plate so that all the liquid is at the bottom of the reaction tube.(3) Low-copy samples, Poisson distributionIf there are 9 templates in tube A (30 μL), the probability of 3 templates per tube is not the same when evenly distributing 10 μL into tubes B, C, and D. If there is no solution for this error, the probability of 3 templates per tube is not the same. There is no good solution for this error.
For more product details, please visit Aladdin Scientific website.